
Founding White Paper · 22 April 2026
The Lag-Lead Trap
Why Local Government Must Embrace the Productivity Revolution — Or Default on the Public Trust
A White Paper from Local Government Accountability (LGAI)
Key Takeaways
- Private-sector productivity has roughly doubled since 2000; local government productivity has barely moved.
- The gap is structural, not cyclical — and it is paid for by the citizens who fund both sectors.
- The next 36 months bring three converging pressures: property tax reform, AI-driven workforce restructuring, and demographic decline.
- Most local governments have no plan for what happens when even a minor economic contraction exposes the gap.
- The tools to close it exist and are already deployed by leading states and cities. Most communities have not adopted them.
Reading time: 14 min
In This Edition
- Private-sector efficiency benchmarks (2026)
- Updated Lag-Lead gap charts
- Executive recommendations for jurisdictions
- July 2026 Update: refreshed 2025-2026 national data (Medill 2025, NLC, Pew) and a fully national evidence base
Interactive charts and a variable-input model are still in the works. This page is the current published edition; the PDF download is the printable version.
Exhibit 1
As local newspapers close, news deserts spread.
U.S., indexed to 2005 = 100 (news deserts 150; newspapers 7,325)
- 213 news-desert counties
- 4,490 newspapers
- Since 2005, U.S. news-desert counties rose from 150 to 213 while the number of newspapers fell from 7,325 to 4,490.
Source: Medill State of Local News, 2025
of the largest U.S. cities reported FY2026 budget gaps
Pew, 2025
The gap is not an accident. It is a choice.
Every other sector of the economy adopted the tools that raised productivity. Local government, with rare exceptions, did not — and protected the budgets and headcounts that the old way required.
LGAI documents that choice, community by community, and puts the cost in front of the citizens who pay it.
Executive Summary
Across 2025 and into 2026, the largest, most profitable corporations on Earth are doing something previously unthinkable: they are eliminating the very middle-management layers that justified their cost structures for two generations. Amazon, Microsoft, Meta, Oracle, Intel, Dell, Dow, Accenture, Coinbase, Block, Atlassian, Cloudflare, PayPal, Snap, Baker McKenzie, Clifford Chance, WPP, Omnicom, Publicis — the list is no longer a list. It is the economy.
The cause is a once-in-a-generation collision of three forces: artificial intelligence that can absorb routine knowledge work, agentic software that can absorb the coordination work that justified middle management, and a Fourth Turning crisis cycle in which institutions that fail to adapt do not merely lose market share — they are dismantled by their own employees, shareholders, voters, or creditors.
Private-sector data is unambiguous. Over 70,000 employees have been impacted by AI-driven layoffs in the first months of 2026 alone, on top of nearly 245,000 tech-sector cuts globally in 2025. Gartner projects that by year-end 2026, one in five organizations will eliminate at least half of their middle-management positions. Coinbase has flattened to a maximum of five layers between CEO and individual contributor. WPP — the former largest advertising group in the world — has dismantled its century-old holding-company architecture to capture £500 million in annual savings. Baker McKenzie, the largest U.S.-based law firm by headcount, fired up to 1,000 support professionals in February 2026 and explicitly cited AI.
Meanwhile, the governments those same taxpayers fund are breaking in the opposite direction. At least 20 of the nation's 25 largest cities reported budget gaps for fiscal 2026, and Chicago, Los Angeles, San Francisco, and Washington each took a credit-rating downgrade inside a single five-month stretch, the Pew Charitable Trusts found. City general-fund spending grew 7.5% in fiscal 2024 on a wave of federal pandemic aid, then all but stopped — 0.7% — the moment that aid ran out, the National League of Cities reported. Councils had already voted that spending into the baseline; it did not reverse when the aid did, and the gap is now surfacing as deficits and downgrades.
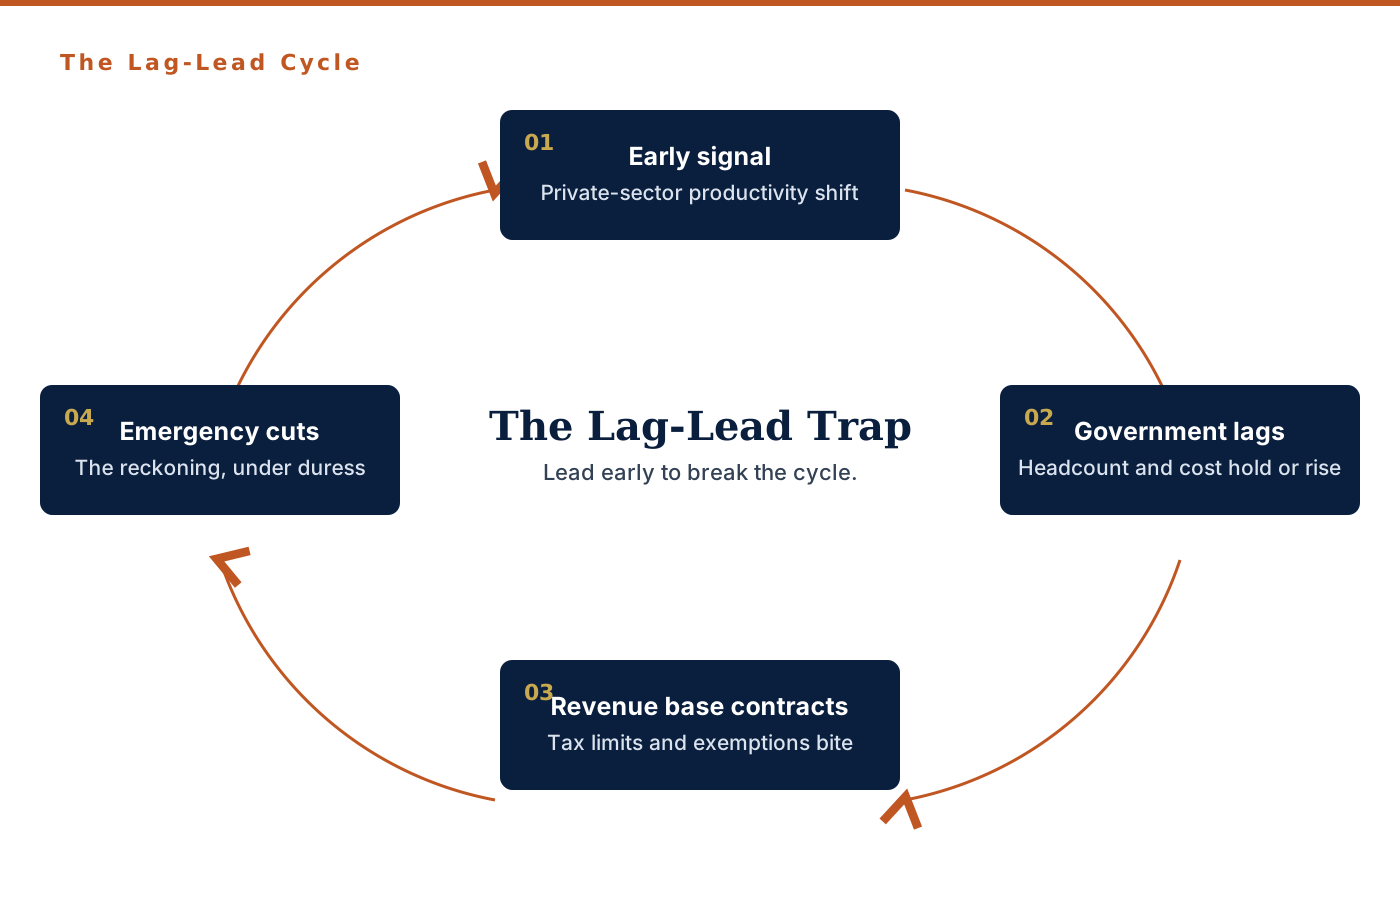
This is the lag-lead trap. Every economic cycle in American history has followed the same pattern: free-market capital rebuilds, governments grow on top of that prosperity until they leech the productive base, and the resulting bloat collapses cities (Detroit), industries (American auto), and entire fiscal regimes (New York City, 1975). The current cycle is now in its terminal phase in the private sector. The reckoning is moving toward government — and local government, as always, is last to see it coming.
This white paper makes the case that local governments must conduct DOGE-style operational audits now, before the property-tax revenue base contracts and forces emergency cuts later. It documents the corporate evidence, the federal precedent, the historical pattern, and the fiscal and oversight data now surfacing nationwide. And it proposes a concrete framework, and a set of governing principles, for how citizen-led oversight institutions like Local Government Accountability (LGAI) hold elected officials to the productivity standard the rest of the economy has already accepted.
Section
The Fourth Turning Moment
Strauss and Howe's framework, developed in the 1990s, holds that Anglo-American history moves in roughly 80-year saecular cycles, with each cycle culminating in a Fourth Turning — a Crisis era in which the institutional order built after the prior crisis is dismantled and replaced. The last three Fourth Turnings in the United States ended in the Revolutionary War, the Civil War, and the combined trauma of the Great Depression and World War II. Whether one accepts the Strauss-Howe model in full or treats it as a useful metaphor, the empirical reality is plain. Institutions across every domain of American life — universities, mainline churches, legacy media, the postwar corporate hierarchy, federal agencies — are losing public trust, fiscal solvency, or both, all at once.
What is genuinely new in this cycle is that the technology layer is no longer neutral. Past Fourth Turnings reorganized labor, capital, and political authority. This one is reorganizing cognition itself. When the routine analytical, coordinative, and supervisory work that defined the postwar middle class can be performed by software, the entire architecture of the modern bureaucracy — public and private — is exposed as economically obsolete. The private sector has begun the painful adjustment. The public sector, especially at the local level, has not.
The institutions that fail this transition will not be reformed. They will be replaced — by reformers from inside if they are lucky, by their own creditors and voters if they are not.
Section
The Private-Sector Earthquake: 2025–2026
2.1 The Numbers Are No Longer Anecdotal
The private-sector adjustment is not a series of isolated decisions. It is a synchronized restructuring across every white-collar industry, executed under explicit reference to AI productivity. The Challenger, Gray & Christmas tracker recorded over 1.2 million U.S. job-cut announcements in 2025 — the highest since 2020 and a 58% increase over 2024. AI was cited as the direct cause in 71,825 of those announcements; restructuring accounted for another 133,611. By the first quarter of 2026, more than 70,000 additional layoffs had been explicitly attributed to AI.
2.2 Headline Cuts: Tech and Adjacent
Exhibit 2
AI is the stated reason, not a rumor.
Named 2025-2026 workforce reductions and the rationale each company gave on the record.
| Company | Cut | Stated Rationale |
|---|---|---|
| Amazon | ~30,000 (Oct 2025 + Jan 2026) | “Reduce bureaucracy,” “remove organizational layers”; flatten management as AI handles coordination, reporting, forecasting |
| Oracle | Up to 30,000 (Mar 2026) | Single-day mass termination tied to $40B AI-datacenter joint venture with SoftBank |
| Intel | 21,000 (~20%) | $500M opex reduction in 2025, additional $1B targeted for 2026 |
| Microsoft | ~15,000 (2025) | Reducing middle management and admin functions while doubling down on AI and cloud |
| Meta | ~8,000 (May 2026) | Targeting nearly 20% of workforce; running “more efficiently” to fund $21B AI cloud commitment |
| Dell | ~23,500 cumulative | Cuts in legacy PC/server divisions while AI server revenue grows 40%+ YoY |
| Block (Square) | ~4,000 (Feb 2026) | Jack Dorsey: “Not driven by financial difficulty, but by the growing capability of AI tools.” |
| Coinbase | ~700 (May 2026) | Flattening to maximum 5 management layers between CEO and ICs |
| Atlassian | 1,600 (10%) | Changes needed for “AI era”; “transferable skills” employees spared |
| Cloudflare | 1,100 (~20%) | Internal AI usage rose 600% in three months |
| PayPal | ~4,760 planned (20%) | “Remove duplication and layers from our organizational structure” |
| Accenture | ~11,000 (Dec 2025) | Restructuring tied to how work is changing inside the firm |
| Dow Chemical | 4,500 (13%) | “Reengineering how work gets done” with best-available technology |
2.3 Law Firms: The Pyramid Collapses
The legal industry has spent 80 years on a leverage model: a small number of partners atop a wide base of associates and staff billing routine work. AI has detonated that base. As of March 2026, 70% of attorneys report using AI weekly, according to industry surveys. In February 2026, Baker McKenzie — the largest law firm by personnel headcount in the Am Law 200, with over 12,000 employees — eliminated between 600 and 1,000 business-services roles, citing AI integration as the reason. Clifford Chance and Perkins Coie have made comparable cuts. Major firms have reduced summer associate programs and slowed lateral hiring of junior associates, because junior work is exactly what AI now performs.
Anthropic's launch of Claude Cowork in early 2026 — an agent capable of automating discrete legal tasks and paperwork — triggered an investor selloff in legal-tech stocks. The implication was understood industry-wide: when a deputy general counsel can resolve a matter with an AI tool instead of paying $1,200 per hour to a top-tier firm, the demand curve for traditional legal labor permanently shifts.
2.4 Advertising Holding Companies: Dismantled
The four global ad-holding-company giants — WPP, Omnicom, Publicis, and Interpublic — have spent the last 18 months in radical restructuring:
- WPP officially ended its holding-company model in February 2026 with the “Elevate28” plan, consolidating Ogilvy, VML, WPP Media, and others into four divisions and targeting £500 million in annual cost savings, with severance estimated at £200 million.
- Omnicom completed its $13 billion acquisition of Interpublic Group in late 2025 and announced $1.5 billion in cost reductions, with thousands of overlapping roles eliminated.
- Publicis surpassed WPP as the world's largest agency holding by revenue, owing largely to early bets on data acquisitions (Epsilon, Sapient) and AI integration.
- Interpublic Group reported approximately 3,200 layoffs in the first nine months of 2025; Omnicom reduced its own headcount by 3,000 the same year.
Cumulatively, Challenger, Gray & Christmas counted over 150,000 announced job cuts citing AI since the start of 2025.
2.5 The Gartner Projection
“By the end of 2026, 20% of organizations could eliminate more than half of middle-management positions through AI-driven flattening.” — Gartner Research
That is one in five organizations cutting half of one entire layer in the corporate hierarchy. Not a forecast about tomorrow — a forecast about year-end of the current calendar year. The mechanism is straightforward: AI handles coordination, status reporting, basic project management, scheduling, document review, and routine analytical work — which are, in aggregate, the bulk of what middle managers actually spend their time doing. The role of the manager is shifting from coordinator to player-coach: a strong individual contributor managing 15-plus direct reports rather than a pure overseer of three to five.
Section
The Federal Signal: DOGE as Proof of Concept
In January 2025, the Trump administration created the Department of Government Efficiency (DOGE) by executive order. By every measure DOGE itself emphasized — total federal outlays, the deficit, the absolute size of the budget — it failed. Federal spending in 2025 surpassed 2024 levels by early December, the deficit grew by nearly $2 trillion, and entitlement spending continued to climb.
But that is not the relevant lesson for local government. The relevant lesson is what DOGE did succeed at: between January and November 2025, federal civilian employment fell by approximately 271,000 workers — a 9% reduction in less than a year, with nearly 60% of the decline occurring in a single month (October 2025) driven by a one-time civil service buyout offer. The Cato Institute described this as “the largest peacetime workforce contraction on record.” Federal employment in November 2025 stood at levels last seen in 2014.
Specific results at agencies that were aggressively reformed are striking:
- USAID: $30+ billion 2024 spend → folded into State Department by November 2025.
- Department of Education: on pace to spend approximately $40 billion less in 2025 than in 2024.
- Federal Communications Commission: spending tracking at roughly one-third of 2024 levels.
- Securities and Exchange Commission and Federal Trade Commission: both pacing materially lower.
The reason DOGE failed to lower the topline deficit is structural: federal civilian payroll is roughly 8% of total spending. Cato estimated that even a 10% workforce cut yields only ~$40 billion annually against a $7.6 trillion budget. The federal government is, ultimately, an entitlement-and-interest-payment machine, and you cannot fix that with workforce reductions alone.
Local government does not have that excuse. There is no Social Security at the county level. There is no Medicare line-item. Local government spending is overwhelmingly personnel and personnel-driven contracts — exactly the categories where AI-augmented productivity gains are real and immediate. If a 9% federal workforce contraction is achievable in 10 months, a comparable or greater reduction is achievable county by county and city by city. There, the savings translate dollar-for-dollar to the property-tax-paying public.
Section
The Lag-Lead Pattern: A Historical Pathology
The relationship between the productive private economy and the government that taxes it has followed a recognizable pattern in every American economic cycle:
Phase 1 — Capital Builds.
Free-market actors — entrepreneurs, manufacturers, financiers — rebuild after a crisis, generating new tax base, new wages, new property values.
Phase 2 — Government Lags.
Government, by structural design, expands more slowly than the economy. For roughly a decade, taxes feel low, services feel adequate, and a virtuous circle holds.
Phase 3 — Government Catches Up, Then Overshoots.
Public-sector compensation, pension obligations, debt issuance, and headcount accelerate. Services proliferate. Administrative overhead grows faster than line services. Bond issues become routine. "We need more revenue" becomes the only available political position.
Phase 4 — The Productive Base Contracts.
A recession, a regulatory shock, a demographic shift, or — in the present case — a productivity revolution makes the prior tax base unsustainable. The same private sector that generated the prosperity now slashes its own costs to survive.
Phase 5 — Government Refuses to Adjust.
Government, having no competitive pressure and no shareholder, continues to grow into the contraction. This is the Detroit problem. This is the New York City of 1975 problem. This is the Stockton, California of 2012 problem. This is the Puerto Rico problem. Every one of them ended in either federal bailout, bankruptcy, or sovereign default — each one preceded by a generation of officials insisting that the spending could continue.
In every case, retrospective analysis identified the same diagnosis: the government in question lagged the private adjustment by 5 to 15 years, and the cost of that lag was paid in service collapses, pension defaults, depopulation, and credit downgrades.
We are now in the early innings of Phase 4 — the private sector is in the middle of restructuring around AI productivity. Local governments across the United States are responding with Phase 3 behavior: more staff, more debt, larger budgets. The historical pattern says the bill comes due in roughly 36 to 72 months.

Section
The Reckoning Arrives
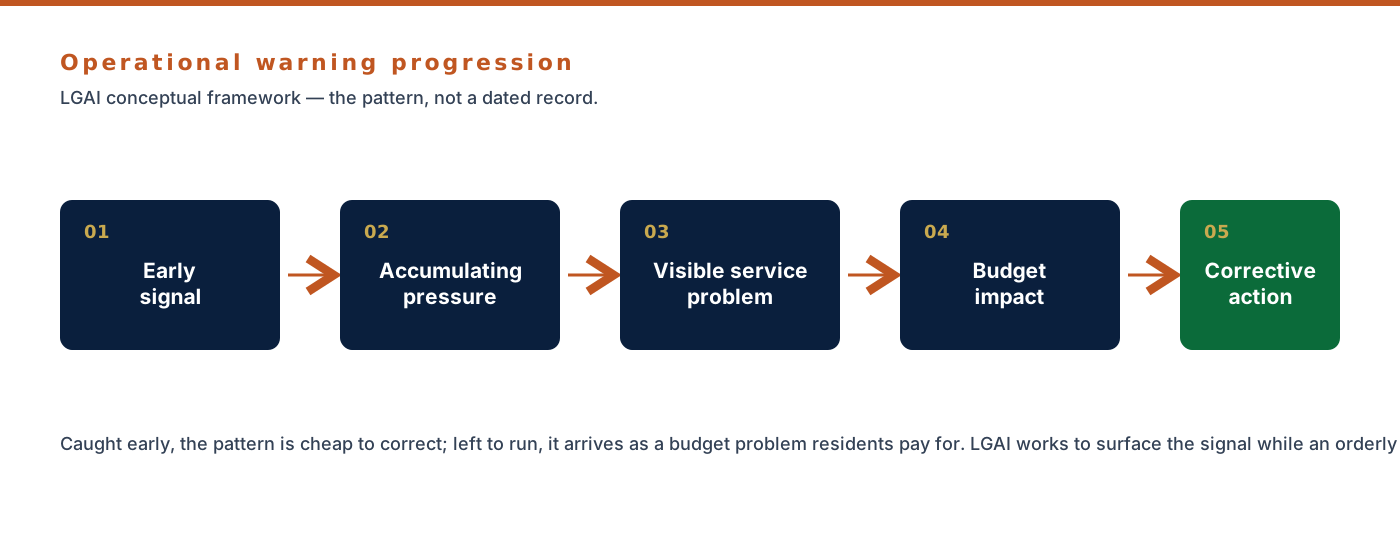
The pattern predicted a bill coming due. In 2025 and 2026 the numbers arrived to confirm it — not in one county, but across the country, on both sides of the trap the lag-lead dynamic governs: the money is running out, and the watchdog that used to catch it is disappearing.
5.1 The Fiscal Gap Is National
At least 20 of the nation's 25 most populous cities reported budget gaps for fiscal year 2026, and Chicago, Los Angeles, San Francisco, and Washington each absorbed a credit-rating downgrade between December 2024 and April 2025, according to the Pew Charitable Trusts. These are not distressed backwaters. They are the largest, richest local governments in the country, and they are running out of room at the same time.
The cause is arithmetic, not mystery. City general-fund spending rose 7.5% in fiscal 2024 on a wave of federal pandemic aid, then growth collapsed to 0.7% in fiscal 2025 as that aid wound down, the National League of Cities found in its 40th annual City Fiscal Conditions report. Councils spent the aid years adding salaries, contracts, and programs to the permanent base. The aid expired; the base did not. What remains is a structural gap.
Reserves are buying time, not closing that gap. Cities entered 2025 with historically high median reserves near 45% of general-fund revenue, yet several large cities are already drawing them down against structural deficits — a bridge, not a fix, in the same Pew analysis. Beneath the operating budget sits a longer obligation: the average public pension was just 76% funded in fiscal 2023, and 13% of plans held less than 60% of what they owe, according to state and local fiscal data compiled by NASACT. The pandemic-aid years let spending decisions outrun scrutiny. The aid is gone. The spending is structural. The gap is surfacing as deficits and downgrades — precisely the lag-lead dynamic this paper named.
5.2 The Watchdog Is Vanishing
Local government grows unchecked in part because fewer and fewer people are left to check it. Northwestern's Medill School counted a record 213 news-desert counties in 2025 — up from 206 a year earlier — with 1,524 more counties down to a single surviving outlet. Roughly 50 million Americans now have limited or no access to local news. Medill, 2025
The losses are accelerating, and they are hitting the most trusted outlets first. In the past year 136 newspapers closed — more than two a week — and, in a shift, most of those closures were small independent owners rather than chains. Since 2005 the country has lost nearly 3,500 papers and more than 270,000 newspaper jobs, as Poynter reported.
Even the survivors reach fewer readers. Web traffic to the 100 largest newspapers fell more than 40% in four years, print circulation is down roughly 70% from 2005, and 250 more counties sit at high risk of becoming deserts within a decade, per Northwestern's State of Local News 2025. The watchdog is disappearing fastest exactly where local government is the only government people touch every day — the permit counter, the patrol car, the school board, the water bill.
Put the two together. A structural fiscal gap is opening in the governments closest to citizens at the same moment the reporters who used to expose it are being laid off. That intersection — real money, no scrutiny — is where the lag-lead trap does its quietest damage. It is also where LGAI works, community by community, documented in LGAI's active community investigations.
Section
The Path Forward: Lead Instead of Lag
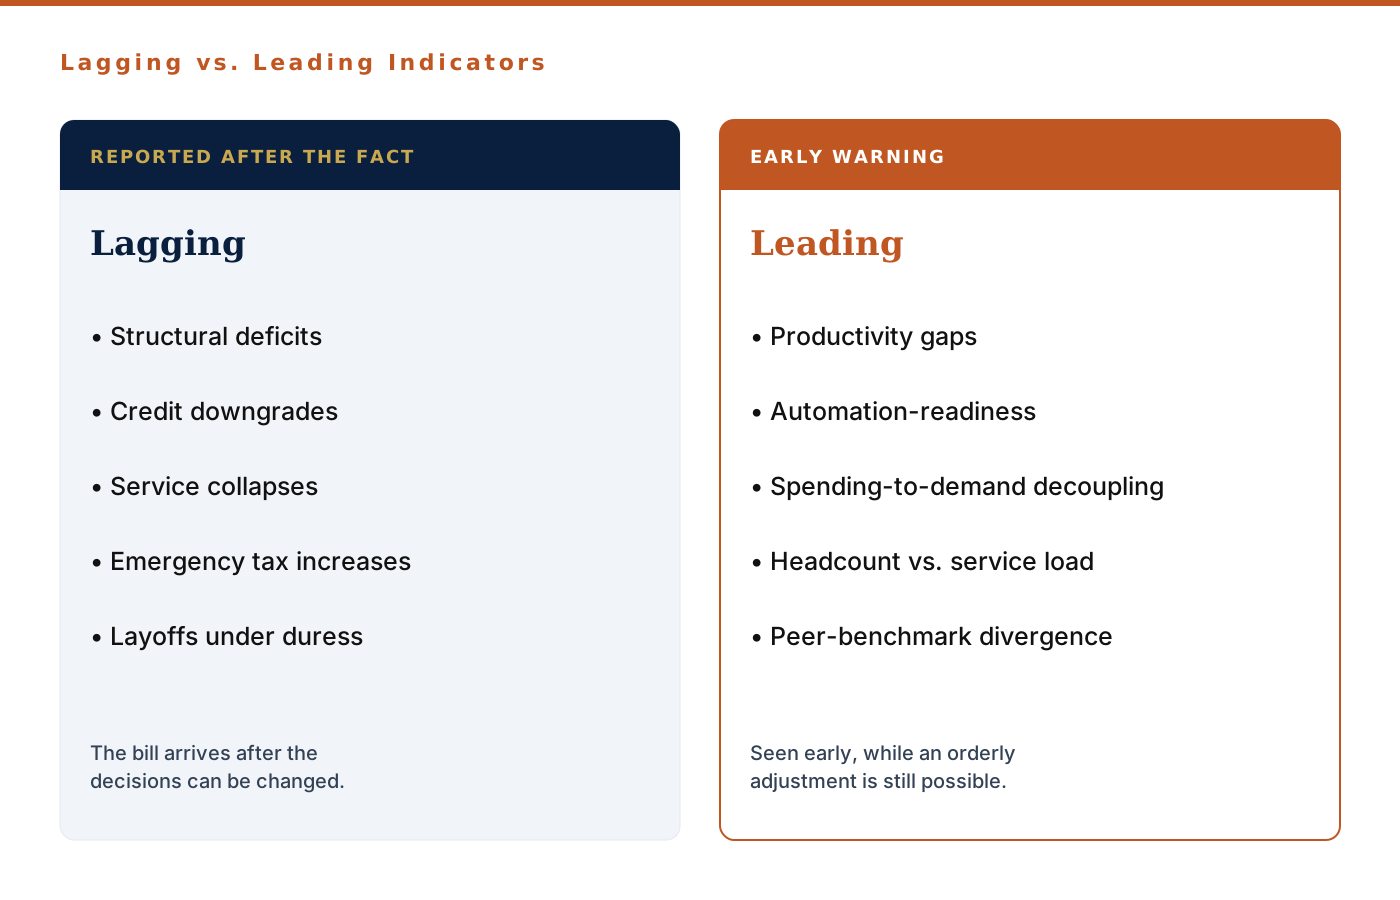
Some state-level governments have begun the adjustment. The pattern they are establishing is exactly what local government should now copy, accelerate, and exceed.
Utah — GRIT Initiative
Governor Spencer Cox launched the Government Reform, Innovation & Transparency initiative in 2025 by executive order, requiring every state agency to identify and pursue efficiency projects with measurable cost, time, and service-quality metrics. AI deployment is widespread. Resident feedback (via QR codes and website widgets) on the “effort, reliability, satisfaction, and compassion” of state services is collected continuously. Agencies that implement evaluator recommendations can redirect part of the savings into staff retention. Reform is rewarded, not punished.
Maryland — Modernization Initiative
Asma Mirza, the state's chief performance officer, has demonstrated that simple cross-agency awareness — for example, of an underutilized statewide shipping contract — produces $800,000 in annual savings on its own. The discipline scales: every agency, every recurring expense, every duplicated function gets re-examined under modern data infrastructure.
State CIOs Nationally
In 2026, AI overtook cybersecurity as the #1 priority for state Chief Information Officers — the first such shift in over a decade, according to the National Association of State Chief Information Officers (NASCIO). State governments are operationalizing AI in eligibility determinations, fraud investigation, permit triage, infrastructure inspection, and provider management.
International Benchmarks
Brazil's AI-driven municipal waste-collection systems have achieved 100% coverage in major cities while reducing collection costs by over 45%. Estonia's Kratt assistant handles a substantial portion of citizen service requests across job recommendations, tax inquiries, and licensing. These are not Silicon Valley pilots — they are operational government services.
None of this is theoretical. It is being done. The barrier to local-government adoption is not technology, capital, or vendor availability. The barrier is the political and bureaucratic incentive structure, which currently rewards growth and punishes contraction.
Section
The LGAI Mandate: A DOGE-Style Audit Framework for Local Government
Local Government Accountability exists to perform, at the county and municipal level, the function that DOGE was created to perform federally — with one critical difference: LGAI is a citizen-led oversight institution, not a government entity. It does not have administrative authority. It has the only authorities that finally matter: data, transparency, and the public record.
7.1 The Seven-Pillar Audit Framework
Pillar 1 — Fiscal Audit.
Year-over-year analysis of total budget, debt service, bond issuances, capital improvement plans, reserve balances, and structural-deficit projections. Mandatory comparison to peer counties (population ±25%, similar tax base, similar geography). Public dashboard. No PDF-only disclosures permitted.
Pillar 2 — Headcount and Compensation Audit.
FTE totals by department, year-over-year change, salary distribution, total compensation including benefits and pensions, and ratio of supervisory to non-supervisory staff. Specific identification of middle-management roles (defined as managers of managers without direct line-service responsibility).
Pillar 3 — Demographic and Service-Demand Audit.
Population trends, age distribution, household income, and actual service-demand metrics (police calls per capita, permit applications per capita, road miles per capita, etc.). Decoupling of "we need more staff" from "the county is growing." Per-capita comparisons across peer jurisdictions.
Pillar 4 — Procurement and Contracting Audit.
All contracts above a defined threshold disclosed publicly with start date, end date, total value, vendor, and renewal status. Sole-source awards flagged. Lobbyist disclosures cross-referenced. Opaque inter-agency transfers — the kind that surface in late-stage budget workshops rather than in open session — are exactly what this pillar forces onto the public record.
Pillar 5 — Technology and Productivity Audit.
Inventory of legacy systems still in use, automation candidates identified (permitting, inspections, intake routing, document processing, financial reporting), and quantified savings projections from AI integration. Public reporting on what was implemented, what was rejected, and why.
Pillar 6 — Political and Disclosure Audit.
Campaign finance disclosure cross-referenced against contracts awarded. Voting records for every elected official. Public attendance records for budget workshops and commission meetings. Non-attendance during a multi-billion-dollar budget vote is a matter of public record and should be flagged as such.
7.2 The Editorial Mandate
LGAI does not exist to issue reports that sit on shelves. It exists to publish — to make the data visible, the patterns undeniable, and the decisions traceable. Every audit should produce a public-facing dashboard, an editorial summary written for the median voter, and a quarterly update tracking what changed.
The model is the investigative civic journalism of the late nineteenth and early twentieth centuries — the muckrakers, the good-government leagues, the bond-rating analysts who could end a mayor's career with a credit downgrade. The tools are different now (Supabase, Next.js, Vercel, AI-assisted data analysis); the principle is identical.
Section
Conclusion: The Window Is Open
The lag-lead trap closes either by reform or by collapse. There is no third option. Detroit chose collapse. New York City in 1975 chose reform — under the duress of imminent bankruptcy. Stockton chose collapse. Cleveland chose reform. The communities that chose reform did so because organized citizens — bond analysts, journalists, civic leagues, taxpayer associations — forced the political class to act before the math forced them to.
The window is open today — for every county and city now writing budgets against a revenue base that has stopped growing. The private sector is providing the productivity playbook in real time. The federal government has demonstrated that even very large workforce reductions are operationally achievable. The technology stack — Supabase, Next.js, AI-augmented financial analysis, public dashboards — is accessible to any citizen group with the discipline to use it.
What remains is the will. Local Government Accountability exists to provide that will, on behalf of the citizens whose money funds the system and whose communities live with the consequences.
The government works for the people. When it forgets that — and most local governments have — it falls to the people to remind it.
This is the founding work.
From white paper to community
Independent · No government money · No candidate money · Every finding sourced
- Published
- 22 April 2026
- Updated
- July 2026
Recommendations
What jurisdictions should do next
- 01Publish a public productivity dashboard comparing per-capita service output to peer jurisdictions.
- 02Mandate AI-assisted records processing for permitting, licensing, and constituent inquiries within 12 months.
- 03Cap administrative headcount growth unless tied to documented service-demand increases.
- 04Require annual Lag-Lead gap disclosure in the adopted budget message.
Efficiency Metrics
Track time-to-permit, cost per constituent transaction, and admin FTE ratio year-over-year. Leading jurisdictions report double-digit cycle-time reductions after phased automation — LGAI cites only government-disclosed figures in published case studies.
Local Government Accountability — Founding White Paper — May 2026