Methodology Paper · 14 May 2026
The Six-Pillar Audit Framework
How the Local Government Accountability Inc Investigates a Community
A Methodology Paper from the Local Government Accountability Inc
Key Takeaways
- A local government cannot be honestly evaluated by its budget alone — six dimensions must be examined simultaneously.
- The seven pillars: Fiscal, Headcount & Compensation, Demographic & Service-Demand, Procurement & Contracting, Technology & Productivity, Political & Disclosure, and Stakeholder Engagement & Impact Measurement.
- No pillar is optional. No pillar is sufficient alone. Each surfaces patterns the others would miss.
- The methodology is fully public and replicable by any citizen group or journalist — not proprietary to LGAI.
- When applied at once, the framework makes it operationally impossible for a corrupt official to hide behind narrow compliance audits.
Reading time: 9 min
June 2026 Enhancements
- Audit templates and worksheet references
- Case study crosswalks
- Stakeholder Engagement & Impact Measurement pillar
Enhanced interactive charts and variable-input models are in active development. This page reflects the current published edition; use the PDF download for the full printable report.
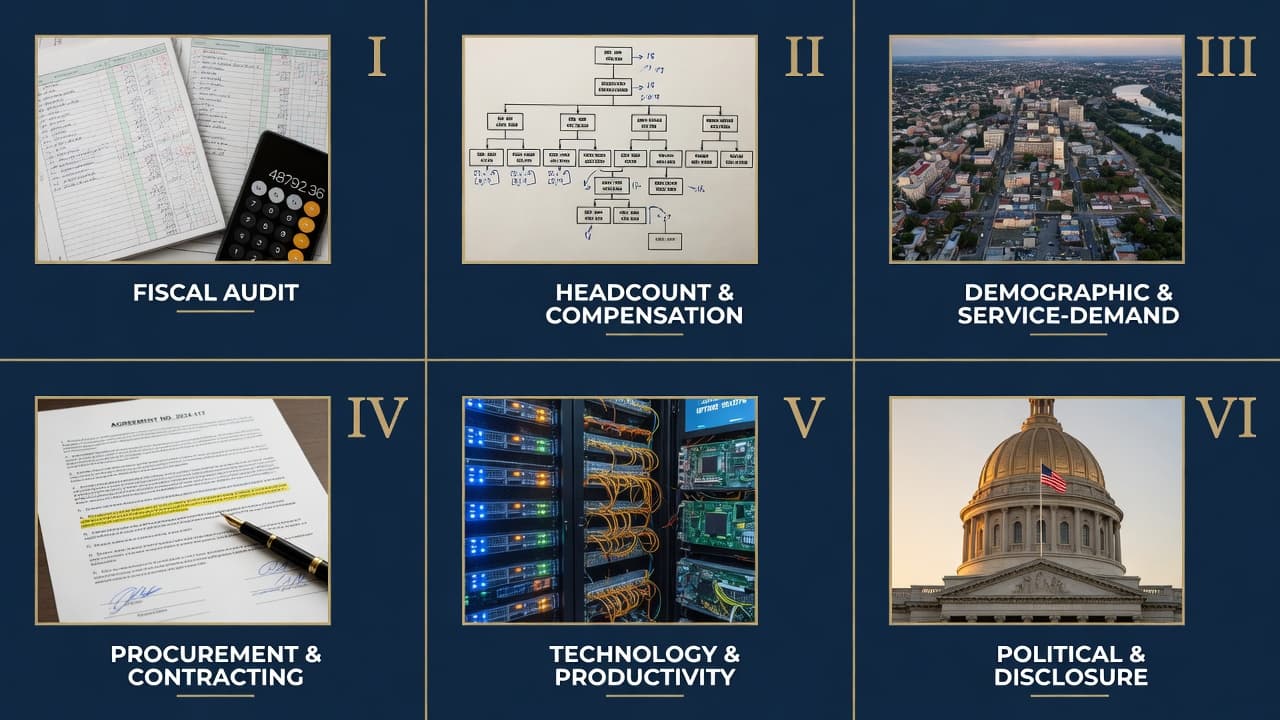
The methodology a corrupt official cannot survive.
Fiscal, headcount, demographic, procurement, technology, political — six pillars applied at once, in writing, with every underlying record open for inspection.
When LGAI opens a community's books, this is the framework that finds what was buried.
Executive Summary
Every Local Government Accountability Inc investigation follows a single, replicable framework. We call it the Six-Pillar Audit. It is the operating manual for how the LGAI converts citizen concerns and public records into published findings that the median voter can use.
This paper documents that framework in full. It is intended for three audiences: (i) the citizens, neighborhood associations, and watchdog groups who refer communities to LGAI for investigation; (ii) the local journalists, civic leaders, and elected officials who want to apply the framework themselves; and (iii) the donors, counsel, and stakeholders who fund and oversee our work. The methodology is public on the principle that any framework worth applying is a framework worth publishing.
The framework rests on a single conviction: a local government cannot be evaluated by its budget alone. A government can balance its budget while quietly hollowing out its reserves. It can claim record service delivery while quietly tripling its administrative overhead. It can pass a balanced ordinance while quietly steering procurement to its donors. The only way to surface what is actually happening is to look at six dimensions simultaneously, in writing, with the underlying records open for inspection. That is what the Six-Pillar Audit does.
Each pillar produces a defined deliverable. Together, the pillars produce the body of work that LGAI publishes for a community. No pillar is optional, and no pillar is sufficient alone.
The Six Pillars at a Glance
| Pillar | Question Answered | Primary Records |
|---|---|---|
| 1. Fiscal Audit | What is the trajectory of this government’s finances? | CAFR / ACFR, adopted budget, bond disclosures, debt service schedules, reserve balances |
| 2. Headcount and Compensation | Who works here, what do they earn, and what is the ratio of management to line service? | Position control reports, salary schedules, total comp filings, org charts |
| 3. Demographic and Service-Demand | Is the cost of government growing because demand is growing — or for some other reason? | Census data, call-volume reports, permit-application logs, per-capita service metrics |
| 4. Procurement and Contracting | Where does the money go, and who gets it? | Contract logs, RFP records, vendor concentration data, lobbyist disclosures |
| 5. Technology and Productivity | Where is this government behind the productivity curve, and what would catching up cost? | IT inventories, legacy-system reports, automation case studies from peer governments |
| 6. Political and Disclosure | Are decisions traceable to the donors and interests that fund the decision-makers? | Campaign finance reports, ethics filings, voting records, attendance records |
| 7. Stakeholder Engagement & Impact | Do citizens recognize and act on the findings — and is impact measurable? | Survey programs, correction logs, dashboard analytics, post-publication policy responses |
The remainder of this paper develops each pillar in operational detail.
Pillar 1
Fiscal Audit
What It Covers
The fiscal pillar establishes the trajectory of the government's finances over a multi-year window. The minimum window is five fiscal years; the standard window for an LGAI investigation is ten. The pillar is not about whether the current year's budget is balanced — that is a low bar that most governments can meet on paper. The pillar is about the direction the government is moving in, measured across the data series that bond-rating analysts, forensic accountants, and serious investors actually use.
Required Records
- The Comprehensive Annual Financial Report (CAFR) — also called the Annual Comprehensive Financial Report (ACFR) — for each year in the window.
- The adopted budget and the proposed budget for each year, including all supporting schedules and budget workshop materials.
- All bond disclosure documents, including official statements, continuing disclosure filings, and credit rating reports.
- Debt service schedules, including principal, interest, and final maturity for every outstanding obligation.
- Capital Improvement Plans, including project lists, funding sources, and out-year obligations.
- Reserve balance schedules for the general fund, the rainy-day fund, the capital fund, and any other restricted or assigned reserves.
- Multi-year financial forecasts and structural-deficit projections prepared by staff for elected officials.
What We Calculate
- Year-over-year change in total budget, total expenditures, and total general fund expenditures, in nominal and real (inflation-adjusted) terms.
- Year-over-year change in total outstanding bond obligations, expressed in absolute dollars and as a percentage of assessed valuation.
- Debt service as a percentage of operating revenue, by year.
- Reserve balances expressed as a percentage of operating expenditures, by year, benchmarked against the Government Finance Officers Association recommended range (17–25 percent for general purpose governments; higher for hurricane-, earthquake-, or wildfire-vulnerable jurisdictions).
- Structural deficit projections as published by staff, with sensitivity analysis for plausible revenue contractions (property tax exemptions, sales tax declines, state revenue-sharing cuts).
- Per-capita expenditure, per-capita debt, and per-capita reserve balance, compared to a benchmark set of peer jurisdictions (defined in the Demographic pillar).
Disclosure Standard
The full data series and all underlying calculations must be published in a public, machine-readable format. We do not accept the standard local-government practice of burying figures inside a 400-page PDF where they cannot be searched, sorted, or recomputed. If the government in question publishes only PDFs, LGAI extracts the data, normalizes it, and republishes the spreadsheet alongside the source documents. Citizens, journalists, and challengers should be able to reproduce every claim.
What We Are Looking For
Three patterns surface most often in this pillar. First, growth that is structural rather than cyclical: spending increases that staff acknowledge will recur in future budgets, rather than one-time pressures attributable to a hurricane, a pandemic, or a federal grant cycle. Second, debt that is being issued to finance current operations or to mask reserve depletion rather than to fund discrete capital projects with defined revenue offsets. Third, structural deficit projections that assume revenue growth which is no longer plausible given state-level tax reform, demographic trends, or property-tax exemption expansion.
Pillar 2
Headcount and Compensation
What It Covers
The headcount pillar establishes what the government's workforce actually looks like. It is not enough to know the total number of full-time-equivalent positions. The pillar asks: who are those people, what do they do, what do they earn, and how does the supervisory layer compare to the line-service layer?
Required Records
- Position control reports for each fiscal year in the window, identifying every funded FTE by department, classification, and salary range.
- Annual salary schedules and total compensation filings, including base pay, longevity pay, overtime, benefits, employer pension contributions, and other post-employment benefits (OPEB).
- Organizational charts at the department, division, and unit level.
- Job descriptions and classifications for every position, with attention to the distinction between supervisory and non-supervisory roles.
- Pension plan reports, including unfunded liability, assumed rate of return, and contribution schedule.
- OPEB liability reports, including retiree healthcare obligations.
What We Calculate
- Total FTEs, by year and by department, with new positions identified by funding source and rationale.
- Total compensation per FTE, by classification, with median and 90th-percentile values reported separately.
- Supervisory-to-non-supervisory ratio, by department.
- Total compensation of the chief administrative officer (city manager, county administrator, superintendent, etc.) as a ratio to the median compensation of front-line line-service workers (police officer, firefighter, public works employee, teacher, code inspector).
- Elected official compensation as a ratio to the median worker.
- Pension funding ratio and unfunded liability per resident.
- Identification of middle-management positions — defined as positions whose primary function is supervising other supervisors without direct responsibility for line service delivery.
Disclosure Standard
The full position-level dataset is published in machine-readable form, with names redacted where state law requires it and exposed where state public-records law permits. Where redactions occur, the rationale is published alongside the data.
What We Are Looking For
Three patterns. First, headcount growth that outpaces population growth and service-demand growth. Second, compensation ratios that have widened materially over the audit window — most often visible as an administrator's compensation rising 4–6x while front-line worker compensation rises 1.5–2x. Third, supervisory layers that have proliferated faster than the line-service workforce, producing manager-to-worker ratios that no peer-quartile private employer would tolerate.
This pillar is the operational core of LGAI's Principle IV — Productivity Parity with the Private Sector. The Gartner Group projects that twenty percent of organizations will eliminate at least half of their current middle-management positions by year-end 2026 through AI-driven flattening. The federal civilian workforce contracted by approximately nine percent in the ten months between January and November 2025. Local governments have, with rare exceptions, not begun this adjustment. The headcount pillar makes that gap visible in numbers.
Pillar 3
Demographic and Service-Demand
What It Covers
The demographic pillar separates two questions that local governments routinely conflate: “Is the cost of government rising?” and “Is demand for government services rising?” The two are not the same. Population can grow ten percent over a decade while police calls per capita fall, fire-rescue volume stays flat, and per-capita road-mile maintenance declines. In that scenario, a government that grows its headcount by twenty percent has not kept pace with demand — it has overshot it. The pillar surfaces the difference.
Required Records
- Census data for the audit window, including population, age distribution, household income, and household composition.
- Service-demand metrics for each major operating department: police calls dispatched per capita; fire-rescue runs per capita; emergency medical service calls per capita; building permits issued per capita; code enforcement cases opened per capita; road miles maintained per capita; recreation facility utilization rates; library circulation per capita; and analogous metrics for any other department that exceeds five percent of the operating budget.
- Demographic projections published by the state demographer, the county planning department, or the regional planning council for the next ten years.
What We Calculate
- Per-capita service-demand metrics for every line-service department, by year, with peer-jurisdiction comparison.
- The decoupling ratio: percent change in spending per capita divided by percent change in service-demand per capita over the audit window. A ratio of 1.0 indicates spending tracking demand; a ratio of 1.5 indicates spending growing fifty percent faster than demand; a ratio above 2.0 is a finding.
- Projected per-capita service demand over the next ten years, based on demographic projections and historical demand trends.
Disclosure Standard
The full per-capita dataset is published. So is the methodology for each metric — for example, whether police calls are defined as dispatched calls, officer-initiated stops, or both. Where state law mandates a particular reporting methodology, that mandate is cited; where local methodology departs from peer practice, that departure is flagged.
What We Are Looking For
The dominant pattern is the “we are growing” justification used to defend administrative expansion that has no demonstrable line-service correlate. A county whose total budget has doubled while population grew thirty percent is not “growing” — it is overshooting growth by a factor of three. The decoupling ratio makes that visible, and it is one of the most powerful tools in this framework for cutting through the rhetorical defense of incumbent spending.
Pillar 4
Procurement and Contracting
What It Covers
The procurement pillar follows the money out of the government and into the private sector. Every dollar spent by a local government either pays a public employee or pays a private vendor. The headcount pillar covers the employees. This pillar covers the vendors.
Required Records
- The complete contract log for each fiscal year in the window, including all contracts above the state-mandated disclosure threshold (typically $35,000 to $100,000).
- For each contract: start date, end date, total contract value, sole-source designation, vendor name, vendor address, contract description, and renewal status.
- Lobbyist disclosure filings, where state law requires them, mapped to the contracts and the elected officials they reference.
- Campaign finance disclosure filings for every member of the governing body for the audit window.
What We Calculate
- Total contracted spending as a percentage of total operating spending, by year.
- Vendor concentration: the percentage of total contracted dollars going to the top five, top ten, and top twenty-five vendors.
- Sole-source awards: percentage of contracted dollars, by year, awarded without a competitive bid; flagged for review where sole-source designations cluster around specific departments or specific vendors.
- Cross-reference: vendors whose principals, executives, or affiliated entities have made campaign contributions to current members of the governing body, with the contracts they have received and the contribution amounts disclosed side by side.
- Renewal pattern: vendors whose contracts have been renewed continuously for more than ten years without competitive re-procurement.
Disclosure Standard
The cross-referenced contract-and-contribution dataset is published. We do not characterize the relationships ethically; we publish the records and let voters draw their conclusions. Some relationships are entirely lawful and proper; some are not. The public record is the record. LGAI presents it.
What We Are Looking For
Patterns that surface in this pillar include perpetual sole-source designations on contracts that should be competitively rebid; vendor concentration in single departments that exceeds peer norms; and contribution-to-contract clustering that, while individually lawful, cumulatively suggests a pay-to-play system the public has a right to see.
Pillar 5
Technology and Productivity
What It Covers
The technology pillar measures the gap between the productivity tools the government in question is using and the productivity tools that the private sector, the federal government, and peer state and local governments are using. It is the operational pillar that connects most directly to Principle IV of the LGAI Guiding Principles.
Required Records
- Information technology inventory: hardware, core enterprise systems, financial systems, permitting systems, GIS systems, records management systems, and human resources information systems.
- IT spending reports, including software licensing, professional services, and internal IT staffing costs.
- Documented automation pilots, including scope, vendor, cost, and reported outcomes.
- Public-facing service metrics that overlap with the demographic pillar: permit processing time, payment processing time, public records request fulfillment time, and call-center wait times.
What We Calculate
- Legacy system inventory: enterprise systems older than ten years that have not been materially upgraded.
- Per-employee IT spending, compared to peer jurisdictions.
- Estimated savings from automation candidates, drawn from documented case studies in peer jurisdictions. Sample reference points used in current LGAI work:
- Hamilton, Ontario, AI permit-review pilot: sixty percent reduction in permit processing time.
- Austin, Texas, Archistar AI deployment: site plan review reduced from a week to three to four minutes.
- Winnipeg AI invoice automation: projected NPV savings exceeding $730,000 from a single workflow.
- Liverpool City Council Jadu AI case management: approximately £1.8 million in annual savings.
- Pennsylvania state ChatGPT rollout: an average of eight hours per week of staff time saved per worker.
- Utah state Claude Code pilot: forty hours of developer time saved across a four-week window.
- Johnson County, Kansas, mental health documentation: per-note time reduced from eighteen to eleven and a half minutes, with up to sixty percent documentation reduction at scale.
Disclosure Standard
Every comparator cited is hyperlinked to its source. The methodology used to project savings for the local government under audit is published. Citizens are entitled to reproduce the calculation; elected officials are invited to dispute it on the merits.
What We Are Looking For
The dominant pattern is the absence of any meaningful automation strategy in a budget environment where automation has become standard practice at the state and city level. A local government that has not commissioned an AI-readiness audit, has not piloted any automation in permitting or financial operations, and has no published technology strategy beyond replacing aging hardware is, in 2026, a government that has chosen to fall behind the productivity curve. That choice has a cost. The technology pillar quantifies the cost.
Pillar 6
Political and Disclosure
What It Covers
The political and disclosure pillar establishes the connection between the decisions made by the governing body and the donors, lobbyists, and interests that fund the decision-makers. It is the most legally sensitive pillar; it is also the one that voters most directly recognize as accountability.
Required Records
- Campaign finance disclosure filings for every member of the governing body for the audit window, including primary, general, and special election cycles.
- Ethics filings, including annual financial disclosures, gift reports, and conflict-of-interest disclosures.
- Voting records on every roll-call vote of the governing body during the audit window.
- Attendance records for every regular and special meeting of the governing body, including budget workshops.
- Recusal records, where state law requires them.
What We Calculate
- For every member of the governing body: total contributions raised, by source (individuals, businesses, political action committees, party committees) and by sector (development, construction, professional services, legal, hospitality, etc.).
- Voting record by topic cluster: budget votes, bond issuances, land-use decisions, procurement awards above a defined threshold, and personnel decisions.
- Cross-reference: votes cast by members of the governing body in which a campaign contributor of $1,000 or more was a direct or indirect beneficiary, with recusal status indicated.
- Attendance: public meetings attended versus public meetings missed, with absences during major budget conversations or contract awards specifically flagged.
Disclosure Standard
We publish the cross-referenced record. We do not allege misconduct on the basis of contribution-to-vote patterns alone, because lawful donors are entitled to vote for candidates who share their views, and lawful candidates are entitled to vote in ways their donors approve of. What we do — and what we believe voters are entitled to — is the side-by-side record. The voter draws the conclusion.
What We Are Looking For
Patterns that surface in this pillar include systematic non-attendance during major fiscal decisions; recusals that occur rarely despite frequent contribution-to-vote overlap; and voting patterns where the contributor-aligned position prevails on close votes within a particular sector (most often development and procurement).
How the Pillars Combine
Each pillar produces a deliverable: a sourced narrative, a normalized dataset, a side-by-side cross-reference table, and a public dashboard. Together, the six deliverables constitute a community investigation file.
A community investigation file produces three published artifacts:
- The Findings Document — a sourced narrative of approximately five to fifteen thousand words, written for the median voter, that summarizes what the records show. Every factual claim is footnoted to a primary public record. Pre-publication, the document is reviewed by a second LGAI researcher; the named officials in the document are notified and given a ten-business-day window to submit factual corrections.
- The Public Dashboard — a permanent, searchable, machine-readable presentation of the underlying data. Citizens, journalists, and challengers can replicate every calculation in the Findings Document.
- The Citizen Briefing — a private, structured briefing delivered to the citizens or organization who referred the community to LGAI. What they do with the briefing is their decision; LGAI does not coordinate political activity, and the briefing is not a campaign deliverable.
Each artifact has a permanent home on a dedicated community research site. Updates are published as new records become available. Corrections, when they occur, are logged transparently with the date, the original claim, the corrected claim, and the source of the correction.
Why Six Pillars and Not Three
A common objection from local officials, and occasionally from sympathetic journalists, is that the framework is too comprehensive — that LGAI should focus narrowly on the budget, or narrowly on procurement, and let voters sort the rest. We reject that framing for a simple reason: every prior generation of local-government oversight has done exactly that, and the result is the present condition. A budget-only focus produced governments that balanced their general funds while quietly tripling their off-budget debt. A procurement-only focus produced governments that competitively bid every contract while quietly steering the underlying specifications to a preferred vendor. The six pillars exist because anything less than six pillars produces blind spots.
The framework is also designed to be replicable by any citizen group with the discipline to apply it. The pillars are not proprietary. The methodology is publicly documented in this paper. The data sources are public records. The output formats — sourced narrative, machine-readable dataset, public dashboard — are standard. LGAI's role is not to monopolize this work; it is to demonstrate it at sufficient quality and scale that citizens in other communities can demand the same of their elected officials, or do the work themselves.
The Standard Is the Stewardship Standard
Every pillar in the framework derives from a single principle, articulated in LGAI's Guiding Principles: every elected official, every appointed administrator, every public employee carries a stewardship obligation that exceeds anything required of a private employee, because public funds are taken under threat of legal compulsion from people who had no choice in the matter. The standard of care owed to those funds is therefore higher — not lower — than the standard a private fiduciary owes to a willing investor.
The Six-Pillar Audit Framework is what enforcement of that standard looks like in practice. The records exist. The methodology is public. The pillars are not negotiable. Every local government in the United States can be audited under this framework. LGAI begins with the communities that ask for it; the rest is a question of time, resources, and the discipline to keep publishing what the records show.
The government works for the people. When it forgets that — and most local governments have — it falls to the people to remind it.
Pillar 7
Stakeholder Engagement & Impact Measurement
Fiscal and operational findings must be tested against citizen experience. This pillar measures whether published accountability work changes behavior — survey participation, correction requests, media pickup, and post-publication policy responses.
LGAI tracks engagement metrics alongside efficiency metrics: time-to-response on records requests, dashboard usage, briefing attendance, and consent-based outreach performance — all disclosed in aggregate, never sold or shared for marketing.
For Citizens, Journalists, and Officials
How to Use This Framework
The Six-Pillar Framework is not proprietary to LGAI. It is fully public, fully documented, and intended for use by any citizen group, journalist, or local official with the discipline to apply it. The steps below describe how to begin in your own community.
- Acquire the records. Request the last five fiscal years of the Comprehensive Annual Financial Report (CAFR/ACFR), the adopted budget, all bond disclosures, and position-control reports. State public-records laws compel disclosure.
- Map all seven pillars. For each pillar, identify the specific records that answer the pillar's central question. The methodology paper above lists them in full.
- Normalize the data. Convert PDFs to machine-readable spreadsheets. Build year-over-year comparisons. Calculate per-capita ratios.
- Apply peer-benchmarking. Identify three to five peer jurisdictions of similar size and demographic profile. Compare each pillar's numbers against the peer median.
- Publish what the records show. Sourced narrative + machine-readable dataset + side-by-side cross-references. Every claim footnoted to a primary public record.
- Notify officials before publication. Give every named official a ten-business-day window to submit factual corrections. Log corrections transparently.
If you would like LGAI to investigate your community using this framework, you can submit a tip at any time.
Recommendations
What jurisdictions should do next
- 01Apply all seven pillars simultaneously — no single-dimension audits.
- 02Publish machine-readable budget and payroll extracts, not PDF-only disclosures.
- 03Add Stakeholder Engagement & Impact Measurement to every annual accountability report.
- 04Open procurement and campaign-finance crosswalks for citizen inspection.
Efficiency Metrics
Efficiency is measured across pillars: fiscal trajectory, headcount ratios, service-demand alignment, contract concentration, technology adoption, disclosure quality, and citizen-reported impact — not a single budget line.
Local Government Accountability Inc · localgovtinstitute.org